Is LJPc hosting down? Check the system status and your server status
Published on November 9, 2026 6 min read
Website or email not working? Check the LJPc hosting system status for outages, see your own server in the portal and find the cause.

Think LJPc hosting is down? Check the system status page first. It shows live whether our mail servers, hosting servers, name servers and network are working. With your own server or a reseller package, the customer portal also shows how your server is doing. If everything is green and your website or email still does not work, the cause is usually in your website, your domain or your own network. Below you find out which one in a few minutes.
Is there an outage? Check the system status page
The system status page is on ljpc-hosting.nl and open to everyone, no login needed. There is also a link at the bottom of every page of our website, under Help & info. We check every component automatically, so you can see at any moment whether something is going on.
The page groups the components into Incoming mail, Outgoing mail and Network and DNS. Each component shows its status in words, with a coloured dot. On a computer you also see the route your mail takes, with the tabs Incoming mail and Outgoing mail. On a phone you get the list only, with the same information.
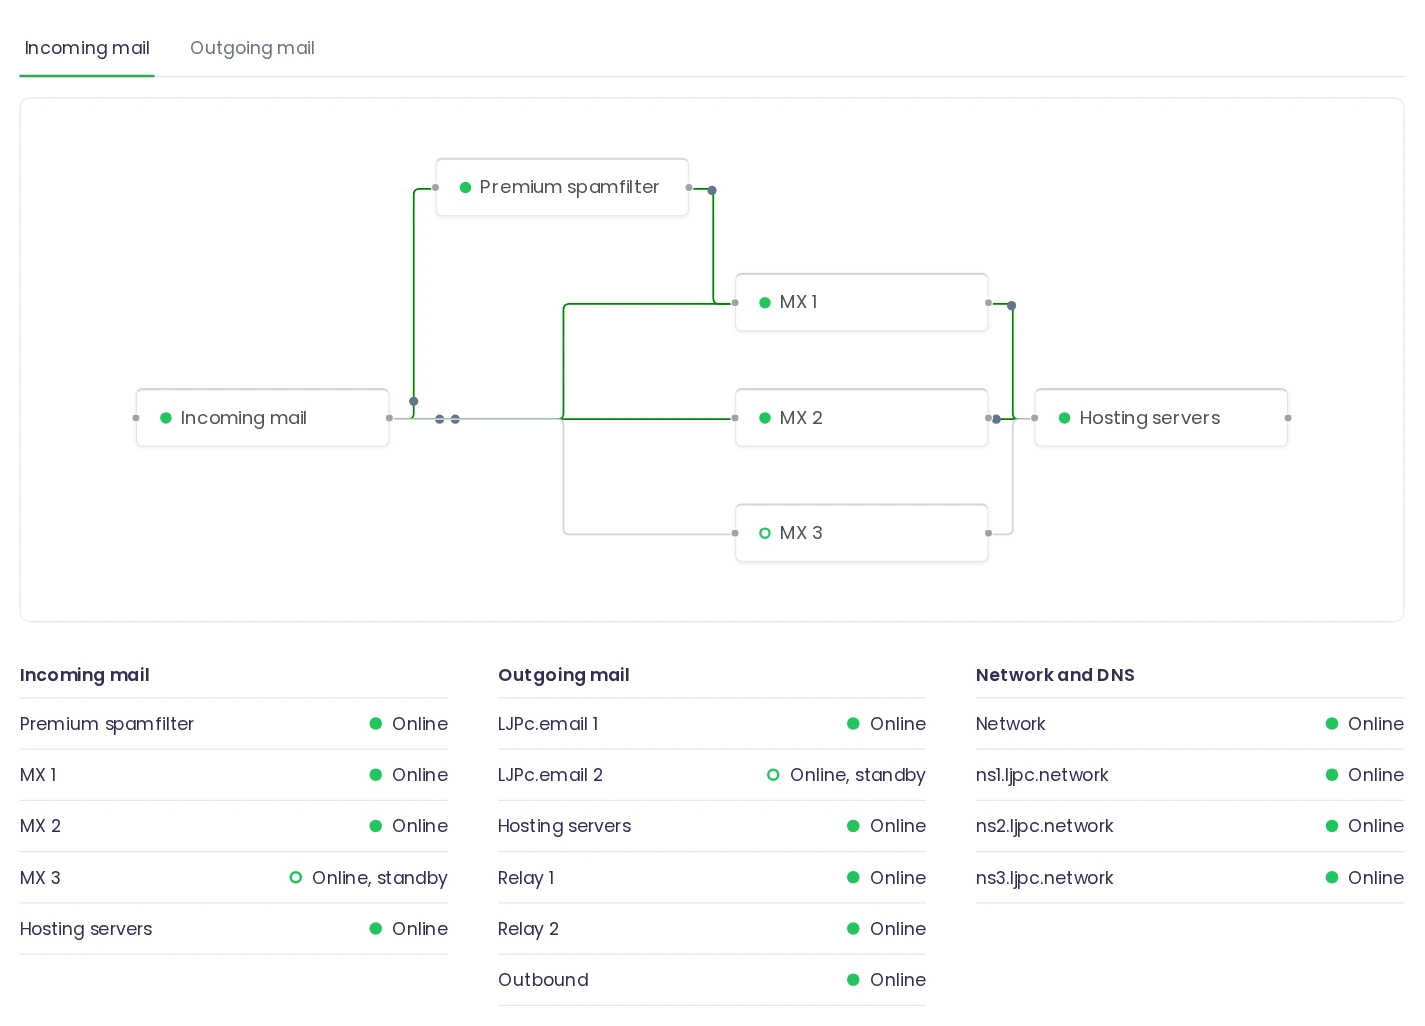
When a component is degraded or down, a notice at the top of the page tells you what is going on. For components with a standby, it also says which one is carrying the traffic now. Refresh the page for the latest status.
How to read the system status
| Status | Dot | What it means |
|---|---|---|
| Online | Green | The component works as it should. |
| Online, standby | Green ring | The component is ready to take over right away. All is well. |
| Degraded | Orange | The component works, but part of it cannot be reached right now. |
| Outage | Red | This component is down. |
| No current reading | Grey | There is no measurement for this component at the moment. |
The mail servers, LJPc.email, the relays and the name servers each have a standby that takes over right away. If one of them goes down, your mail keeps flowing through another.
What each component does for you
| Component | What it does |
|---|---|
| MX 1, MX 2 and MX 3 | Receive the mail sent to your address. MX 3 is the standby. |
| Premium spamfilter | Filters incoming mail for domains with the premium spam filter. |
| Hosting servers | The servers that hold your website and mailbox. They appear together as one component. Orange means some of the servers cannot be reached. |
| LJPc.email 1 and 2 | The mail server ljpc.email that your email app connects to. LJPc.email 2 is the standby. |
| Relay 1, Relay 2 and Outbound | Deliver the mail you send to the recipient. |
| Network | The network that connects our servers. |
| ns1, ns2 and ns3.ljpc.network | Our name servers. They tell the rest of the internet where to find your website and mail. See NS record explained for how name servers work. |
Own server or reseller package? Check your server status in the portal
With your own server or a reseller package at LJPc, the customer portal shows how your server is doing. Web hosting customers share a server with other customers; for them, the system status page is the place to look.
- Log in to the customer portal. See log in to the customer portal if you need help.
- Your dashboard has a Server health card. For each server it shows a coloured dot, a small CPU graph and the CPU and RAM percentages. With more than five servers, View all servers opens the full list.
- Click a server, or go to Services and choose Servers in the menu. This opens the details page of that server.
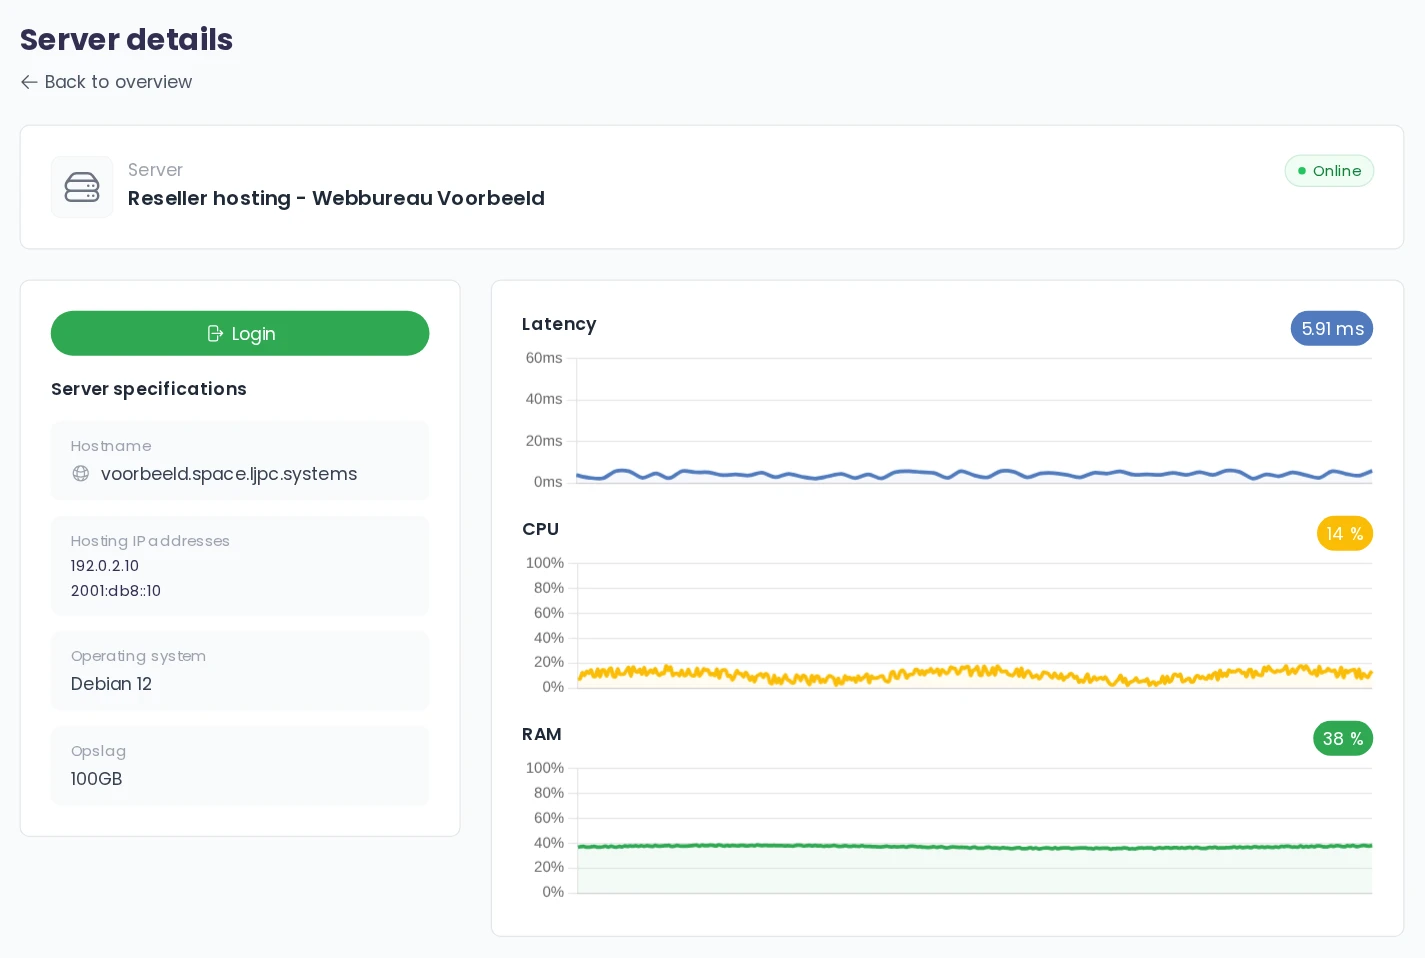
At the top right of the server page you see whether your server is Online or Offline. Below are three graphs: Latency (how fast your server responds, measured from our network) and CPU over the last 30 minutes, and RAM over the last 24 hours. The graphs refresh every 15 seconds while the page is open. On the left you find the hostname, IP addresses and operating system of your server, plus the Login button that opens your server's control panel. To open Plesk from the portal, see open Plesk from the customer portal.
What the dot colour on your dashboard means
| Colour | When |
|---|---|
| Green | CPU, memory and response time are within normal values. |
| Orange | CPU use is above 80%, memory use above 85% or the response time above 200 ms. |
| Red | CPU use is above 95%, the response time above 500 ms, or no measurements are coming in right now. |
A short peak is normal: a backup, an update or a busy day can push CPU use up for a while. If your server stays orange for a long time and your website feels slow, the tips in speed up your website help. If your server shows Offline or stays red, create a support ticket.
Have your own server but no Servers item in the menu? If you use a sub-account, ask the main user for the View servers permission (see sub-accounts in the customer portal).
Everything is green, but your website or email is down?
The system status shows how our shared components are doing. Whether a single website works also depends on the website itself, your domain and the network you are on. Work through these steps:
- Try another network. Turn off Wi-Fi on your phone and open your website over mobile data. If it works there, the IP address of your own network is probably blocked. See IP address blocked to lift the block.
- Look at exactly what you see. An error such as 500 or a blank white page means the server responds and the cause is usually in the website. Find the reason in the error log in Plesk.
- Did you recently change something in your domain? After a move or a change to your name servers or DNS records, it can take a while before every network uses the new data. Read DNS propagation and troubleshoot DNS problems.
- Is your domain still active? If your domain is registered with us, the portal shows the status of each domain under Services, Domains.
- Is it about email? Read fix email problems or look up your message in email client errors.
Report an outage
Still stuck, or does an outage on the system status page affect you? Let us know with a support ticket in the portal, or call us on +31 85 130 6429. These details help us get started right away:
- which website, domain or email address it is about;
- what you see, with the exact error message or a screenshot;
- since when it has been happening;
- whether it does work on another network, such as mobile data.
Is your website completely down outside office hours and can it not wait until the next working day? Emergency support after hours explains how to reach us right away.
Frequently asked questions
Where can I see whether LJPc hosting has an outage?
On the system status page at ljpc-hosting.nl/en/system-status. It shows live how our mail servers, hosting servers, name servers and network are doing. When something is degraded or down, a notice at the top tells you what is going on.
The system status is green, but my website is down. How is that possible?
The system status shows our shared components. Whether a single website works also depends on the website itself, your domain and your own network. Try your website over mobile data, check which error you get and whether you recently changed your DNS.
What does Online, standby mean on the system status page?
That the component is ready to take over right away when another one goes down. Nothing is wrong. MX 3 and LJPc.email 2 normally show Online, standby.
Why do I not see a server status in the customer portal?
The Server health card and the Servers menu item appear when you have your own server or a reseller package at LJPc. Web hosting customers use the system status page. Sub-accounts also need the View servers permission.
What does an orange or red dot next to my server mean?
Orange means CPU use above 80%, memory use above 85% or a response time above 200 ms. Red means CPU use above 95%, a response time above 500 ms or no measurements coming in. If your server stays red or shows Offline, create a support ticket.
How do I report an outage?
Create a support ticket in the customer portal or call +31 85 130 6429. Say which website, domain or email address it is about, what you see, since when, and whether it works on another network.