How to view error logs in Plesk: find the cause of a 500 error or blank page
Published on November 9, 2026 6 min read
Blank page, "critical error" or a 500 error on your website? Open the error log in Plesk and find the line that shows what went wrong.

If your website shows a blank white page, the message "There has been a critical error on this website" or a 500 error, the real cause is almost always in your website's error log. You open it in Plesk: go to your domain and click Logs under Dev Tools. Filter on error and read the newest lines: they tell you which file, plugin or setting causes the error.
This article shows you how to open the error log, how to read an error message and what to do next. New to Plesk? Start with our Plesk control panel guide.
Which error do you see on your website?
On the website itself you usually only see a short message or an empty page. The technical details are in the log.
| What you see | What is usually going on | Where to look |
|---|---|---|
| A blank white page, or "There has been a critical error on this website" in WordPress | A PHP error that stops the page, often caused by a plugin, a theme or a new PHP version | Apache error, line with "PHP Fatal error" |
| 500 Internal Server Error | A PHP error or a line in .htaccess the server does not understand | Apache error |
| 502 Bad Gateway, 503 Service Unavailable or 504 Gateway Timeout | The web server got no answer, or no timely answer, from PHP, for example because a script runs too long | Apache error and nginx error |
| "Allowed memory size of ... bytes exhausted" | Your website needs more memory than PHP is allowed to use | See how to change PHP settings in Plesk |
| 403 Forbidden | The server or your website refuses to show the page | See how to fix a 403 Forbidden error |
If the error started right after a switch to a newer PHP version, how to prepare your website for a PHP upgrade explains what can break and how to check your site afterwards.
How to open the error log in Plesk
- Open Plesk from the customer portal: go to Services > Sites, open your site and click Log in to Plesk in the Site overview block. See open Plesk from the customer portal for details.
- Go to Websites & Domains and click the Dashboard tab in your domain's card.
- Under Dev Tools, click Logs. You see the latest lines from all log files of your website, newest at the bottom.
- In the filter row, click the box under Type (it says Any) and leave only error ticked. Now you only see errors.
- Read the bottom lines. Date shows when the error happened, Message shows the error itself and Source shows which log file the line comes from.
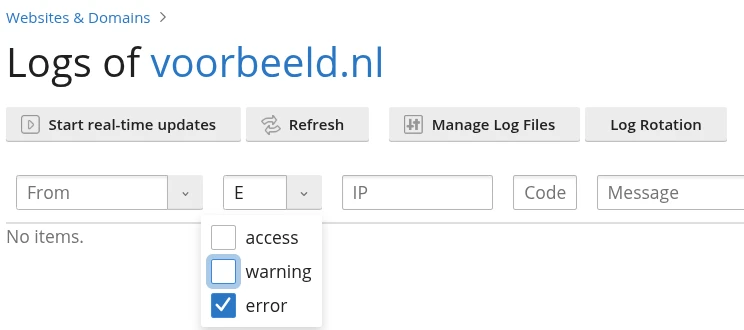
If it says "No items.", no line in the period shown is marked as an error. Continue with No error in the list?
Watch the log live while you trigger the error
Not sure which line belongs to your problem? Trigger the error again while you watch:
- On the Logs page, click Start real-time updates.
- Open your website in another tab and reload the page with the error.
- Go back to Plesk. The new line appears at the bottom, with the time of a moment ago.
- Click Stop real-time updates when you are done. Later, Refresh loads the newest lines manually.
No error in the list?
Plesk does not mark every message as an error. Tick all boxes under Type again and search by text instead. The filters work like this:
| Filter | Use it to |
|---|---|
| From | Show only lines from a certain date onwards |
| Type (Any) | Choose from access (visits), warning and error |
| IP | Show only lines from one IP address, for example your own connection |
| Code | Find visits with a certain status code, for example 500 or 404 |
| Message | Search for a word in the message, for example PHP, Fatal or the name of a plugin |
At the top right, All logs lets you choose which log files you see:
- Apache error: error messages from PHP and the web server. This is almost always where you find the cause. Your errors are in Apache error even if your website runs on a server with LiteSpeed.
- Apache access and Apache SSL/TLS access: every visit to your website, with its status code. Useful to see which page returned a 500 or 404.
- nginx error, nginx access and nginx SSL/TLS access: the logs of nginx, which sits in front of the web server on some of our servers. Check nginx error when you get a 502 or 504.
How to read an error message
A PHP error in the log looks like this, for example:
PHP Fatal error: Uncaught Error: Call to undefined function example_function() in /var/www/vhosts/yourdomain.com/httpdocs/wp-content/plugins/example-plugin/example.php:12Sometimes there is extra text in front, such as "AH01071: Got error 'PHP message:". That is the web server passing on the message from PHP. Look for three things:
- The type of message. A Fatal error or Parse error stops the page: that causes a blank page or a 500 error. A Warning, Notice or Deprecated message lets the page load, but points to code that needs attention, for example before you move to a newer PHP version.
- The path. If it contains
wp-content/plugins/example-plugin, the error is in that plugin.wp-content/themes/points to your theme. - The line number after the colon. Your web developer needs it to fix the error.
What to do once you have found the cause
- A plugin or theme. Update the plugin or theme, or deactivate the plugin. If you can no longer get into WordPress, rename the plugin's folder in
wp-content/pluginsunder Files in Plesk, for example toexample-plugin-off: WordPress then deactivates the plugin. WordPress recovery mode helps too, see how to update WordPress safely. - After switching PHP versions. Switch back to the previous version, then update your plugins and theme. See how to change the PHP version in Plesk.
- A message about memory, upload size or time. Increase the matching setting, see how to change PHP settings in Plesk.
- An error in .htaccess. Restore your backup of the file or remove the last line you added, see .htaccess: redirects, security and more.
Turn on the WordPress debug log (debug.log)
WordPress has its own log, debug.log, which also records messages from WordPress itself. Turn it on when the Plesk error log does not tell you enough. In Plesk you do this with WP Toolkit:
- Click WordPress in the menu on the left and find your website's card.
- Next to Debugging, open the settings (Debug Settings).
- Tick WP_DEBUG and WP_DEBUG_LOG and untick WP_DEBUG_DISPLAY, so your visitors do not see the messages. Click OK.
- Trigger the error again, then open
wp-content/debug.logunder Files in Plesk.
Prefer editing wp-config.php? Add these lines above the line /* That's all, stop editing! */:
define( 'WP_DEBUG', true );
define( 'WP_DEBUG_LOG', true );
define( 'WP_DEBUG_DISPLAY', false );
While WP_DEBUG_LOG is on, PHP writes your website's messages to debug.log instead of the Plesk error log. Turn debugging off as soon as you know the cause and delete debug.log. The file keeps growing, counts towards the storage of your hosting plan, and WordPress advises against debugging on a live website. Read more about storage in check your storage usage. The options are explained in the WordPress documentation.
Download a log file or send it to support
On the Logs page, click Manage Log Files. You see all log files of your website with the date they last changed and their size. The green arrow downloads a file, the blue icon opens it in a separate window.
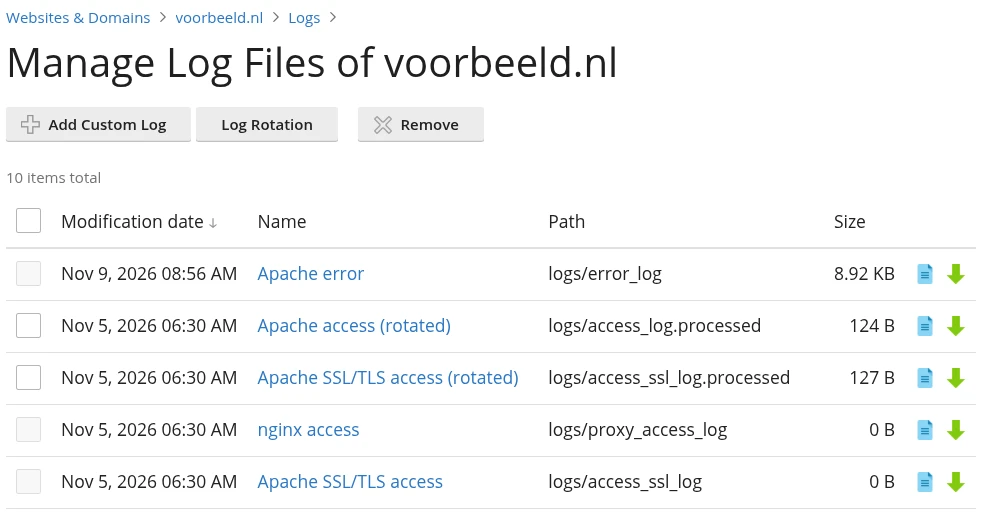
Still stuck? Create a support ticket. Include the website, the time the error happened and the line you found in the log. See create a support ticket for how it works.
Frequently asked questions
Why do I see a blank page without an error message?
A PHP error stops the page, but the message itself is not shown on your website. The server writes it to the error log. In Plesk, open Logs for your domain and filter on error: the newest line with "PHP Fatal error" tells you which plugin, theme or file causes the problem.
Why is the log called Apache error when my server uses LiteSpeed?
Plesk always calls the error_log file Apache error, also on a server with LiteSpeed. On all our servers it contains the error messages from PHP and the web server.
Do log files count towards the storage of my hosting plan?
The log files you see under Logs are stored next to your website and do not count towards the storage figure in the customer portal. Plesk does include them in its own figure. A WordPress debug.log sits inside your website folder and does count: delete it when you are done troubleshooting.
What do Warning, Notice and Deprecated mean in the log?
Your website still works, but the code needs attention. Deprecated means a plugin or theme uses something that will disappear in a future PHP version. Update your plugins and theme, especially before you move to a newer PHP version.
Can I delete a log file?
In Manage Log Files you can only delete older log files that Plesk has already rotated. The current log file stays, so new errors are always recorded.
Do my visitors see PHP error messages?
No, display_errors is off by default on our servers. PHP writes the messages to the error log, not to your website. If you turned on display_errors in PHP Settings or WP_DEBUG_DISPLAY in WordPress yourself, turn it off again once you have found the cause.